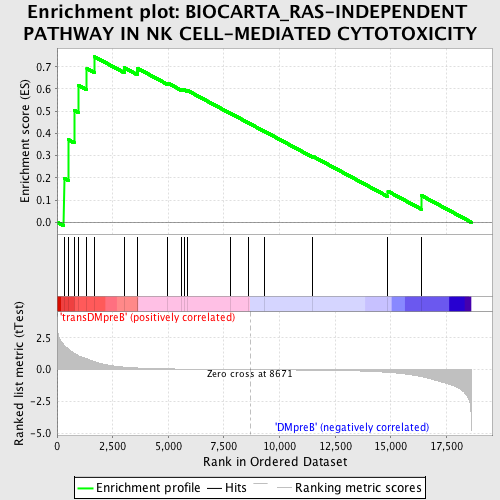
Profile of the Running ES Score & Positions of GeneSet Members on the Rank Ordered List
| Dataset | Set_04_transDMpreB_versus_DMpreB.phenotype_transDMpreB_versus_DMpreB.cls #transDMpreB_versus_DMpreB.phenotype_transDMpreB_versus_DMpreB.cls #transDMpreB_versus_DMpreB_repos |
| Phenotype | phenotype_transDMpreB_versus_DMpreB.cls#transDMpreB_versus_DMpreB_repos |
| Upregulated in class | transDMpreB |
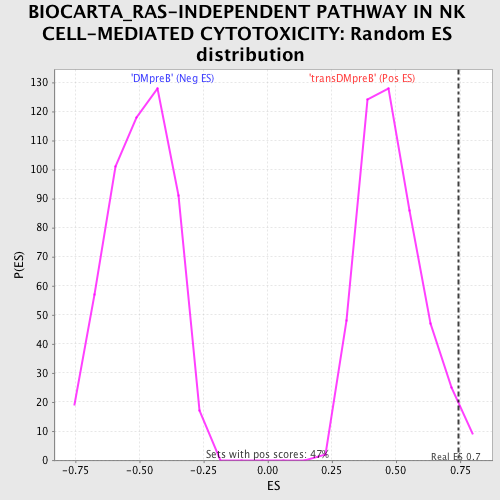
| GeneSet | BIOCARTA_RAS-INDEPENDENT PATHWAY IN NK CELL-MEDIATED CYTOTOXICITY |
| Enrichment Score (ES) | 0.7445252 |
| Normalized Enrichment Score (NES) | 1.5429232 |
| Nominal p-value | 0.02771855 |
| FDR q-value | 0.3261925 |
| FWER p-Value | 0.99 |
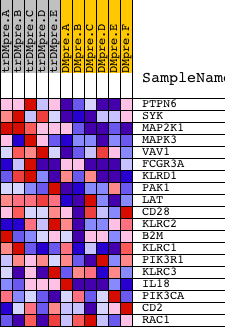
| PROBE | DESCRIPTION (from dataset) | GENE SYMBOL | GENE_TITLE | RANK IN GENE LIST | RANK METRIC SCORE | RUNNING ES | CORE ENRICHMENT | |
|---|---|---|---|---|---|---|---|---|
| 1 | PTPN6 | 17002 | 309 | 1.905 | 0.1991 | Yes | ||
| 2 | SYK | 21636 | 513 | 1.619 | 0.3715 | Yes | ||
| 3 | MAP2K1 | 19082 | 767 | 1.285 | 0.5034 | Yes | ||
| 4 | MAPK3 | 6458 11170 | 961 | 1.090 | 0.6164 | Yes | ||
| 5 | VAV1 | 23173 | 1340 | 0.841 | 0.6912 | Yes | ||
| 6 | FCGR3A | 8960 | 1689 | 0.636 | 0.7445 | Yes | ||
| 7 | KLRD1 | 17266 | 3022 | 0.197 | 0.6952 | No | ||
| 8 | PAK1 | 9527 | 3601 | 0.130 | 0.6789 | No | ||
| 9 | LAT | 17643 | 3622 | 0.129 | 0.6924 | No | ||
| 10 | CD28 | 14239 4092 | 4981 | 0.059 | 0.6261 | No | ||
| 11 | KLRC2 | 9243 | 5575 | 0.044 | 0.5992 | No | ||
| 12 | B2M | 72 14882 | 5712 | 0.042 | 0.5966 | No | ||
| 13 | KLRC1 | 9242 | 5861 | 0.038 | 0.5930 | No | ||
| 14 | PIK3R1 | 3170 | 7780 | 0.010 | 0.4910 | No | ||
| 15 | KLRC3 | 16975 | 8618 | 0.000 | 0.4461 | No | ||
| 16 | IL18 | 9172 | 9316 | -0.008 | 0.4095 | No | ||
| 17 | PIK3CA | 9562 | 11493 | -0.039 | 0.2969 | No | ||
| 18 | CD2 | 15223 | 14872 | -0.213 | 0.1394 | No | ||
| 19 | RAC1 | 16302 | 16377 | -0.547 | 0.1204 | No |